A plot in the time domain is specified as:
plot: [<TimePlotSpec>]* ;where <TimePlotSpec> can be:
impulse( <transfer function> )<transfer function> can be either F, G, or H, as defined in Section 7.2.1.
step( <transfer function> )
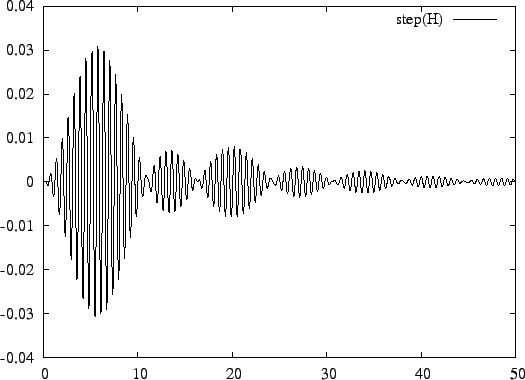
In the example below, the step response of a bandpass filter is determined:
chebyshev(3, 3.0);
transform: bandpass(10, 1);
time= lin(0, 50, 1000);
plot: step(H);
The filter is generated from a third order Chebyshev lowpass equivalent filter, as explained in Section 6.2. The result is shown in Figure 11.