FA uses three transfer functions, designated by the letters F , G and H . H is the transfer function of the filter from input to output. F is a vector of transfer functions from the input of the filter to the outputs of the integrators of the filter, and G is the vector of transfer functions from the inputs of the intrinsic integrators to the output of the filter.
Plotting H will result in one curve in the output, but plotting F or G will result in a number of curves that is equal to the order of the filter.
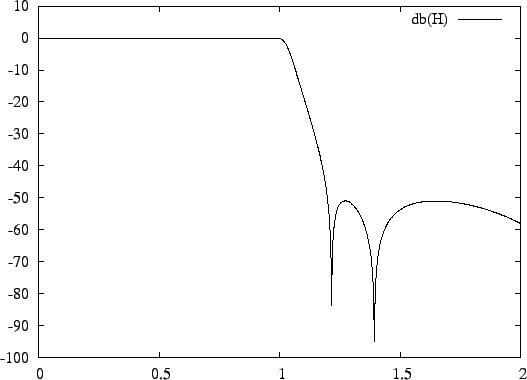
magn, phase, delay, and db signify the magnitude, the phase, the group delay, and the magnitude in decibel of the specified transfer function, respectively. If this keyword is omitted, the real and imaginary part are plotted.
As an example, let an input file example.in contain the
following FA commands.
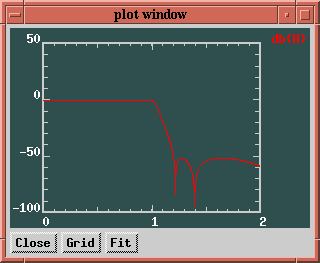
cauer(7, 0.1, 1.2);
freq = lin (0, 2, 1000);
plot: db(H);
Executing FA with this file as input results in a file called example.plot. Plotting the contents of this file with gnuplot results in the plot of Figure 9. Using the xplot command in stead of the plot command results in an interactive X window, shown in Figure 10.